Performance Measurement and Tools
In computer software, performance improvement follows performance measurement. After finishing some small optimization sessions, I decided to both define a repeatable performance measurement process and to build tools to support it. We’ll examine the process and initial measurements in this post, and we’ll review my progress in the next few posts.
I’m interested in measuring two general conditions. The first is the average state of things over the lifetime of the application. The second is the instantaneous state of things; conditions at a given moment in time. Average information is helpful for optimizing to improve average frame rate. Instantaneous information is helpful for optimizing exceptional behavior. The sudden frame rate drops I’ve been seeing are exceptional behavior. Analyzing average performance data doesn’t reveal them; they’re hidden in the averaging.
The Process
Here’s the initial process I’ve adopted for average measurement and optimization.
Run a timed test of application code in question under cProfiler.
Analyze cProfiler results with snakeviz or callgrind_annotate. Select a function to optimize.
Analyze the cost of the selected function using callgrind_annotate and line_profiler.
Make code changes. Run another timed test. Compare results and repeat until satisfied.
Commit changes.
This one is for instantaneous measurement and optimization. [1]
Run a timed test of application code with frame-by-frame measurements.
At the beginning of each frame, start cProfiler.
At the end of each frame, stop cProfiler and save the results for the frame.
At the end of each frame, log timing information from the frame for later analysis.
Identify the exceptional frames. This is the set of frames for which the frame’s performance is significantly worse than the frame preceding it.
Select the worst exceptional frame from the session.
Perform the average optimization process described above, using the data from the exceptional frame.
The Tools
I made some changes to the demo framework code to support this process. Before beginning the engine update loop for the frame, the application code starts the frame timer and the profiler. After the engine update loop ends, it stops both. The application then sends timing information for the frame to the statistics module. The statistics module logs a JSON event with the information for the frame. This process repeats for each frame through the life of the application.
Here are examples of JSON events for 3 frames.
2018-05-21 12:30:53,295 - statistics - INFO - frame - {'frame_num': 0, 'time_start': 1526931053.2692273, 'time_end': 1526931053.2937021, 'ms_per_frame': 24.4748592376709, 'variation': 0, 'entity_count': 13}
2018-05-21 12:30:53,310 - statistics - INFO - frame - {'frame_num': 1, 'time_start': 1526931053.2955983, 'time_end': 1526931053.3093357, 'ms_per_frame': 13.73744010925293, 'variation': -0.43871219132044226, 'entity_count': 19}
2018-05-21 12:30:53,324 - statistics - INFO - frame - {'frame_num': 2, 'time_start': 1526931053.3101385, 'time_end': 1526931053.323486, 'ms_per_frame': 13.347625732421875, 'variation': -0.02837605650913761, 'entity_count': 25}
After finishing the application run, we have frame-by-frame profiler sessions and timing statistics. This is enough information to do both average and instantaneous analysis for a session.
I wrote tools in Python to visualize the data for analysis as follows:
Transform the JSON frame events into a numpy recarray for further processing.
Print summary performance statistics from the run.
Identify exceptional frames.
For each exceptional frame,
Process the frame’s profiler session through pyprof2calltree and callgrind_annotate.
Print the costliest function from the frame.
Use matplotlib to create statistical graphs.
With repeatable process and tools ready, we can analyze real session data.
The Data
There following data are from a long session I ran after first noticing the frame rate drops. An exceptional frame in this analysis is defined as a frame with a duration > 0.5 times that of the previous frame. Here are the summary statistics.
Session start (sec): 1526931053.27
Session end (sec): 1526933520.75
Session length (sec): 2467.48
ms/frame (mean): 87.80
ms/frame (median): 79.32
ms/frame (std dev): 75.96
Exceptional frames (variation multiple > 0.5): 96
sec/exceptional frame: 25.70
ms/frame (mean): 798.30
ms/frame (median): 278.32
ms/frame (std dev): 1029.25
Active entities (mean): 206.07
Active entities (median): 205.00
Active entities (std dev): 17.90
The data will be more useful when we compare it relative to later runs after optimizing. It is still valuable on its own. Since I’ve qualitatively deemed the frame rate unstable by watching it on my monitor, the data establish a quantitative baseline for the same.
Some quick observations.
Frame rate varies by up to 87% in only one standard deviation. In other words, 68% of frames in this run are 87.80 +/- 75.96 ms/frame.
On average, there is an exceptional frame (ms/frame >50% longer than the frame before it) every 25.7 seconds.
On average, each exceptional frame takes 9.09 times as long as each normal one.
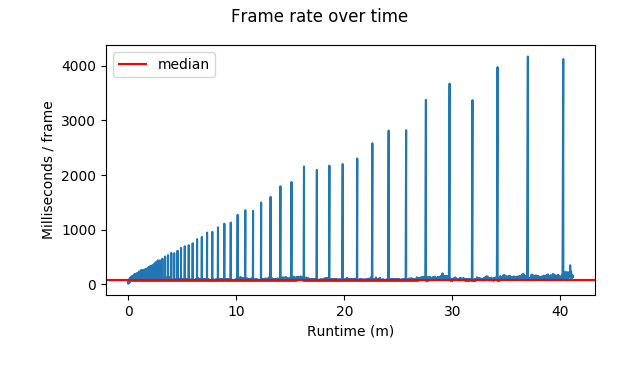
The following graph shows the times for each frame over the entirety of the run.

Each of the spikes appears to be an exceptional frame. This visualization also shows the severity of the exceptions worsening over time, which isn’t apparent from the summary statistics. There are frame times over 4 seconds toward the end of the run. The average frame rate seems mostly stable, although it looks a little like it creeps upward after about 33 minutes.
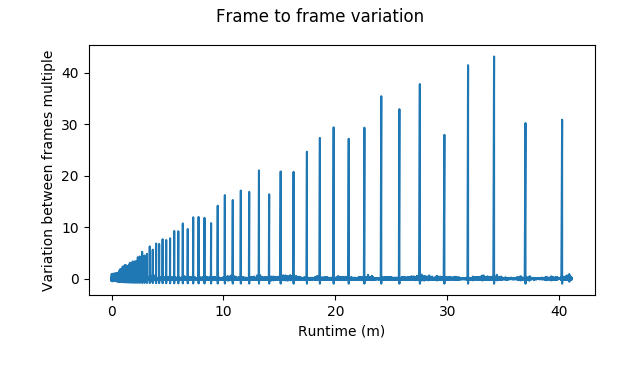
The following graph shows frame to frame variation. This is the duration of each frame, relative to that of the previous frame.

Some frames take more than 40 times as long as their preceding frames!
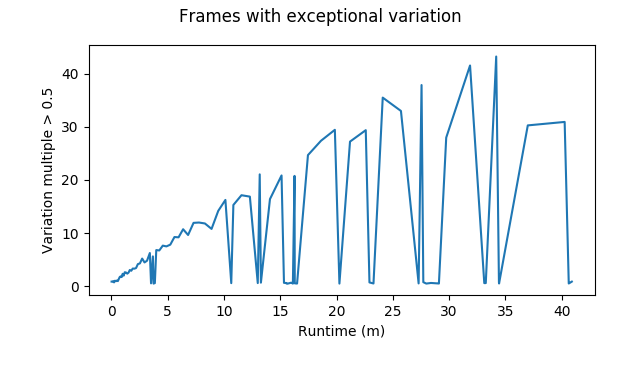
The following graph also shows frame to frame variation, but only for the exceptional frames.

Unsurprisingly, the shape is the same of the previous graphs. The exceptions get worse as the session lengthens.
Finally, here are the most expensive functions for the 5 worst exceptional frames, according to callgrind.
Frame  # ms/frame          call site

25798  4167.9699420928955  /usr/lib/python3.6/site-packages/ng/math/vector.py:__init__
27314  4120.220422744751   /usr/lib/python3.6/site-packages/ng/ng.py:_entities_velocity
24394  3972.6834297180176  /usr/lib/python3.6/site-packages/ng/math/matrix.py:__matmul_
21420  3672.304391860962   /usr/lib/python3.6/site-packages/ng/ng.py:_entities_velocity
20191  3374.32861328125    /usr/lib/python3.6/site-packages/ng/math/matrix.py:__init__
This analysis shows the worst frame rate issues happen when using ng’s math
facilities. vector.py and matrix.py are ng’s vector and matrix
classes. ng.py:_entities_velocity is the function that updates each
entity’s position using its velocity vector.
Next?
Did I miss anything useful in the analysis above? If so, please let me know.
Thanks for reading! Next time, we’ll review my progress optimizing the math modules and resulting measurements.