Optimizing Matrix Operations
Last time, we reviewed some major frame rate issues I found in ng and established a process to measure and improve on the problem. We reviewed performance of a long-running test and identified the 4x4 matrix and vector modules as major culprits. Today, we’ll do line-by-line analysis of the slow parts and review my progress optimizing them.
Performance Analysis
Recapping the last measurements, here are the most expensive functions for the 5 worst exceptional frames, according to callgrind. This list was generated by the performance tool I wrote to do this exceptional frame analysis.
Frame  # ms/frame  call site

25798  4167.96     /usr/lib/python3.6/site-packages/ng/math/vector.py:__init__
27314  4120.22     /usr/lib/python3.6/site-packages/ng/ng.py:_entities_velocity
24394  3972.68     /usr/lib/python3.6/site-packages/ng/math/matrix.py:__matmul_
21420  3672.30     /usr/lib/python3.6/site-packages/ng/ng.py:_entities_velocity
20191  3374.32     /usr/lib/python3.6/site-packages/ng/math/matrix.py:__init__
The most expensive operations are initializing new matrix and vector class instances and multiplying matrices. These math operations are used per frame, per entity to update entity positions and to prepare MVP matrices for display output.
_entities_velocity indirectly uses vector operations through its own
function calls, so it may drop off the list when vector is optimized. We’ll
focus on vector and matrix right now.
The goal of this session is to reduce the number of usages of the vector and matrix modules, as well as to improve the performance of each usage.
Let’s use callgrind_annotate to get more information about the call
patterns. To reduce the number of calls to a function, we need to know who is
calling. We add the --tree=caller option to get this info. To improve the
performance of the function, we need to know which lines perform worst. We add
the --auto=yes option so callgrind will annotate the source lines of each
module with the amount of time spent in each line.
Here are the header and the call tree for frame 25798, which give us more
details on calls to vector.py:__init__.
$ callgrind_annotate --auto=yes --tree=caller  emitter-25798.pstats.cg
--------------------------------------------------------------------------------
Profile data file 'emitter-25798.pstats.cg'
--------------------------------------------------------------------------------
Profiled target:  (unknown)
Events recorded:  ns
Events shown:     ns
Event sort order: ns
Thresholds:       99
Include dirs:
User annotated:
Auto-annotation:  on

--------------------------------------------------------------------------------
           ns
--------------------------------------------------------------------------------
4,167,334,999  PROGRAM TOTALS

--------------------------------------------------------------------------------
           ns  file:function
--------------------------------------------------------------------------------

      415,000  < /usr/lib/python3.6/site-packages/ng/ng.py:_entities_velocity (255x) []
       34,000  < /usr/lib/python3.6/site-packages/ng/render/__init__.py:normalized_vertices (32
x) []
       20,000  < /usr/lib/python3.6/site-packages/ng/entity.py:size:128 (8x) []
      521,000  < /usr/lib/python3.6/site-packages/ng/math/bounding_box.py:aa_box (492x) []
       14,000  < /usr/lib/python3.6/site-packages/ng/entity.py:origin:118 (8x) []
4,040,391,999  < /usr/lib/python3.6/site-packages/ng/math/vector.py:__iadd__ (242x) []
       26,000  < /usr/lib/python3.6/site-packages/ng/ng.py:entity_create (8x) []
       34,000  < /usr/lib/python3.6/site-packages/ng/entity.py:velocity:170 (8x) []
       87,000  < /usr/lib/python3.6/site-packages/ng/entity.py:__init__ (40x) []
    1,238,000  < /usr/lib/python3.6/site-packages/ng/render/opengl.py:_draw_entity (984x) []
      278,000  < /usr/lib/python3.6/site-packages/ng/math/vector.py:__mul__ (242x) []
      235,000  < /usr/lib/python3.6/site-packages/ng/entity.py:position:137 (250x) []
       11,000  < /usr/lib/python3.6/site-packages/ng/entity.py:scale:159 (8x) []
4,042,445,000  *  /usr/lib/python3.6/site-packages/ng/math/vector.py:__init__
Most of the calls in the graph look innocuous at a glance. There may be
opportunity to optimize some of those call patterns later, but nothing stands
out since they are all necessary for the update routine. The calls to
vector.py:__init__ from vector.py:__iadd__ and vector.py:__mul__
look suspicious, though. These are bound methods used for class instantiation
and operator overloading. The callgrind analysis shows us the lines for
__iadd__.
      .      def __iadd__(self, other: Any) -> 'Vector':
147,000          other = Vector(other)
      .
      .          self.x += other.x
180,999          self.y += other.y
278,000  => /usr/lib/python3.6/site-packages/ng/math/vector.py:__init__ (242x)
      .          self.z += other.z
      .
      .          return self
This method overloads the += operator, performing vector addition with a
scalar value and mutating the original vector instance. This operation doesn’t
need to allocate a new vector, but the first line creates a new vector instance
from the user’s input. I intended this as a convenience, allowing the user to
call the method with another type such as a tuple. Removing this convenience
will significantly reduce the number of Vector allocations. Here’s the change:
def __iadd__(self, other: Vector) -> 'Vector':
    self.x += other.x
    self.y += other.y
    self.z += other.z

    return self
The __sub__ and __add__ methods had a similar pattern, so I also
changed those. With these changes, we can expect frame 25798 to be improved
and can move to frames 24394 and 20191. These both spend a lot of time in the
matrix module. I did a quick comparison of 20191 and 24394 and saw that they
are similar, so we can review only 24394.
Here are the callgrind header and tree for frame 24394.
$ callgrind_annotate --auto=yes --tree=caller  emitter-24394.pstats.cg
--------------------------------------------------------------------------------
Profile data file 'emitter-24394.pstats.cg'
--------------------------------------------------------------------------------
Profiled target:  (unknown)
Events recorded:  ns
Events shown:     ns
Event sort order: ns
Thresholds:       99
Include dirs:
User annotated:
Auto-annotation:  on

--------------------------------------------------------------------------------
           ns
--------------------------------------------------------------------------------
3,972,006,999  PROGRAM TOTALS

--------------------------------------------------------------------------------
           ns  file:function
--------------------------------------------------------------------------------

3,889,429,000  < /usr/lib/python3.6/site-packages/ng/entity.py:matrix_init (4074x) []
    2,352,000  < /usr/lib/python3.6/site-packages/ng/render/opengl.py:_render_entity (410x) []
    2,343,000  < /usr/lib/python3.6/site-packages/ng/render/opengl.py:_draw_entity (784x) []
3,881,484,999  *  /usr/lib/python3.6/site-packages/ng/math/matrix.py:__matmul__

   57,394,000  < /usr/lib/python3.6/site-packages/ng/render/opengl.py:_render_entity (198x) []
   59,996,999  < /usr/lib/python3.6/site-packages/ng/render/opengl.py:update (7x) []
   21,398,999  *  /usr/lib/python3.6/site-packages/ng/render/opengl.py:_render_entity

   30,022,000  < /usr/lib/python3.6/site-packages/ng/render/opengl.py:_render_entity (205x) []
   10,284,999  *  /usr/lib/python3.6/site-packages/ng/render/opengl.py:_draw_entity

    5,807,000  < /usr/lib/python3.6/site-packages/ng/math/matrix.py:__matmul__ (5268x) []
    5,807,000  *  ~:<built-in method numpy.core.multiarray.matmul>

    5,312,000  < /usr/lib/python3.6/site-packages/ng/math/matrix.py:__init__ (6767x) []
    5,312,000  *  ~:<built-in method numpy.core.multiarray.array>

    7,177,999  < /usr/lib/python3.6/site-packages/ng/entity.py:matrix_init (252x) []
3,882,551,000  < /usr/lib/python3.6/site-packages/ng/entity.py:position:137 (198x) []
   11,371,000  < /usr/lib/python3.6/site-packages/ng/entity.py:rotation:148 (211x) []
      819,000  < /usr/lib/python3.6/site-packages/ng/entity.py:children_add (6x) []
      135,000  < /usr/lib/python3.6/site-packages/ng/entity.py:scale:159 (6x) []
      151,999  < /usr/lib/python3.6/site-packages/ng/entity.py:origin:118 (6x) []
    4,083,000  *  /usr/lib/python3.6/site-packages/ng/entity.py:matrix_init
The worst performer, matrix.py:__matmul__, is the matrix multiplication
operator on the Matrix class. The engine makes heavy use of this operation
while calculating entity model matrices and while preparing MVP matrices for
display rendering.
Again, there might be opportunity to improve caller efficiency, but let’s see how we can optimize this method in the matrix module.
Here are the line-by-line costs of the methods.
            .  class Matrix():
    3,702,999      def __init__(self, values):
    5,312,000  => ~:<built-in method numpy.core.multiarray.array> (6767x)
    2,327,000  => ~:<method 'tolist' of 'numpy.ndarray' objects> (6767x)
            .          self._np_array = np.array(values)
            .
            .          self.values = self._np_array.tolist()
            .
            .      def _columns(self):
            .          return len(self.values[0])
            .
3,881,484,999      def __matmul__(self, other):
    5,807,000  => ~:<built-in method numpy.core.multiarray.matmul> (5268x)
    6,831,999  => /usr/lib/python3.6/site-packages/ng/math/matrix.py:__init__ (5268x)
            .          return Matrix(np.matmul(self._np_array, other._np_array))
The only purpose of the Matrix class is to be a wrapper around the numpy
array. The original ng Matrix class implemented matrix operations in Python.
That was slow, so I previously changed it to use a numpy array for its
underlying operations, leaving Matrix as a wrapper class.
The price of the wrapper class is apparent; every time we create a new matrix or multiply two matrices, we incur the cost of a new Python class instance that serves only to create a new numpy array instance underneath it.
Wrapping third party APIs is a good practice in certain languages and situations, allowing one to protect one’s own APIs from changes to third party APIs. In this case, though, performance is the larger consideration.
If the wrapper class were very important to the design, one potential optimization would be to rewrite the matrix class as a C library. In this case, numpy is ubiquitous in the Python computation space and carries a stable API, so I’m comfortable using it directly instead of wrapping it. I ditched the Matrix class entirely and ng now directly uses numpy arrays for all matrix operations.
The Data
Here’s the data from a new run measured after the changes. I reformatted it a bit to compare it more easily with the data from the last run.
Metric |
Run 0 |
Run 1 |
|---|---|---|
Session length (s) |
2467.48 |
628.72 |
ms/frame (mean) |
87.80 |
64.17 |
ms/frame (median) |
79.32 |
63.10 |
ms/frame (std dev) |
75.96 |
15.68 |
Exceptional frames (variation multiple > 0.5 |
96 |
46 |
|
25.70 |
13.67 |
|
798.30 |
208.43 |
|
278.32 |
149.94 |
|
1029.25 |
144.21 |
Active entities (mean) |
206.07 |
243.30 |
Active entities (median) |
205.00 |
247.00 |
Active entities (std dev) |
17.90 |
21.54 |
The first thing to highlight is this run length is much shorter than the last. Because there will be several iterations of optimization, I decided to do shorter 10 minute runs for the intermediate iterations. The caveat is we can’t directly compare the summary data from this run to the last; the decreased session length affects the averaged data.
That’s okay. Again, this will be a series of improvements. We don’t need to do a direct session-to-session comparison to answer the questions I want to answer right now.
Are there still exceptional frames?
If so, how often?
If so, are the exceptions getting worse over time?
The first two questions are answered by the summary data. Yes, there are still exceptional frames. They happen several times per minute on average.
Metric |
Last Run |
This Run |
|---|---|---|
Exceptional frames (variation multiple > 0.5 |
96 |
46 |
|
25.70 |
13.67 |
Let’s look at the graphs.


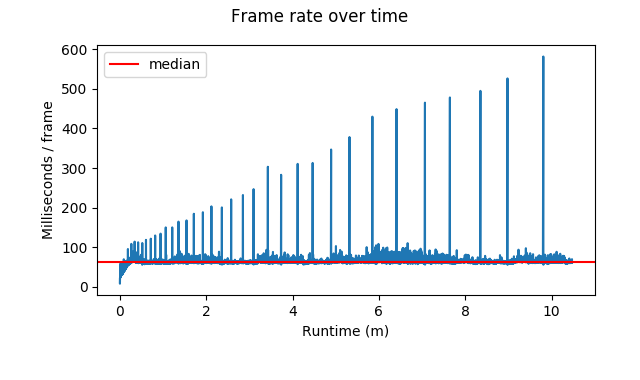
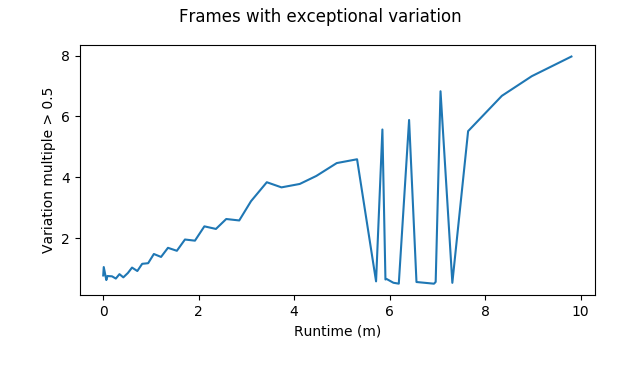
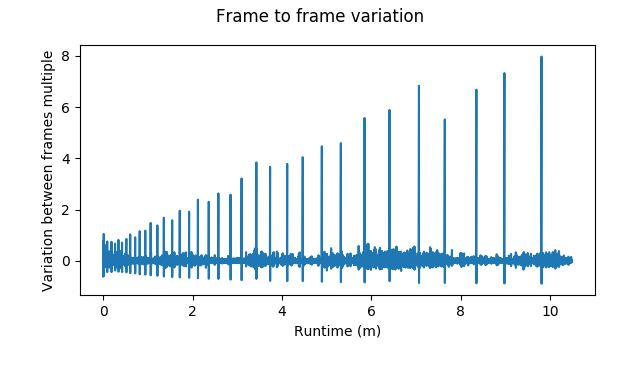
The spikes in the graph indicate the same pattern as before. The frame-to-frame variation worsens over the length of the session.
Here’s the new short list of expensive calls.
Frame # ms/frame  call site
8980  581.74      /usr/lib/python3.6/site-packages/ng/math/bounding_box.py:aa_box
8232  526.43      /usr/lib/python3.6/site-packages/ng/math/vector.py:__init__
7645  494.95      /usr/lib/python3.6/site-packages/ng/math/bounding_box.py:aa_box
6999  478.29      /usr/lib/python3.6/site-packages/ng/math/vector.py:__init__
6484  465.14      /usr/lib/python3.6/site-packages/OpenGL/wrapper.py:calculate_cArgs
Finally, some good news. The matrix module has dropped off the list of worst
offenders and numpy’s array multiplication routines are not on the list. This
suggests replacing the matrix class with numpy arrays improved things. The
vector module is still there, indicating we might be able to improve it
further. boundingbox_py.aa_box is new to the list. That function uses the
vector module, so it’s reasonable to expect that vector is the bottleneck for
aabox. An internal call in the PyOpenGL library is also new to the list this time.
Next?
We could continue to optimize the vector module. However, I’m certain we can make improvements there. I have less knowledge and certainty around the PyOpenGL library, because it is third-party code. Also, since ng’s OpenGL renderer is my first experience using OpenGL, I made some early design mistakes and already have some TODO items to fix there. For these reasons, PyOpenGL is the greater concern. I’ll leave the vector module for now and focus on improving OpenGL usage next.
Thanks for reading! Next time, we’ll look at my OpenGL optimizations, and review measurements of another run.